Multisubject Annotations & Custom Point Marks
Features:
- All axes will automatically draw a
<line>element with classaxis-baselinealong the baseline of the axis. You can restyle or hide it with CSS. react-annotationannotations in XYFrame and ORFrame will honor acoordinatesarray and draw multi-subject annotations when you send datapoints in that array.customPointMarkin XYFrame can now return any JSX SVG instead of just asemiotic-mark<Mark>element. It also passes{ d, i, xScale, yScale }so you can draw marks whose shape depends on data values in chartspace.
Fixes:
motifsmode in NetworkFrame is working again. Singletons are now sorted into a single component.
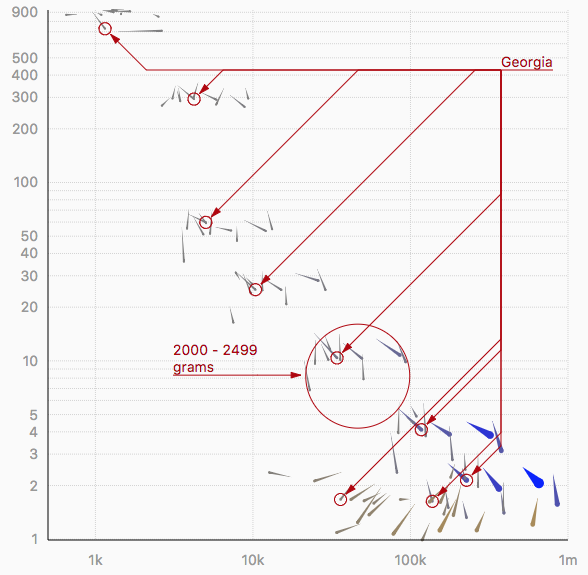
You can see most of this in action in the Comet Plots example.